TCF Profiling
TCF profiler supports profiling of both standalone and Linux applications. TCF profiling doesn’t require any additional compiler flags to be set while building the application. Profiling standalone applications over Jtag is based on sampling the Program Counter through debug interface. It doesn’t alter the program execution flow and is non-intrusive when stack trace is not enabled. When stack trace is enabled, program execution speed decreases as the debugger has to collect stack trace information.
- When the application stops at main, open the TCF profiler view by
selecting Window > Show View > Other > Debug > TCF Profiler.
-
Click the
 button to start profiling.
The Profiler Configuration dialog box appears.
button to start profiling.
The Profiler Configuration dialog box appears.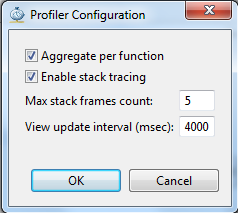
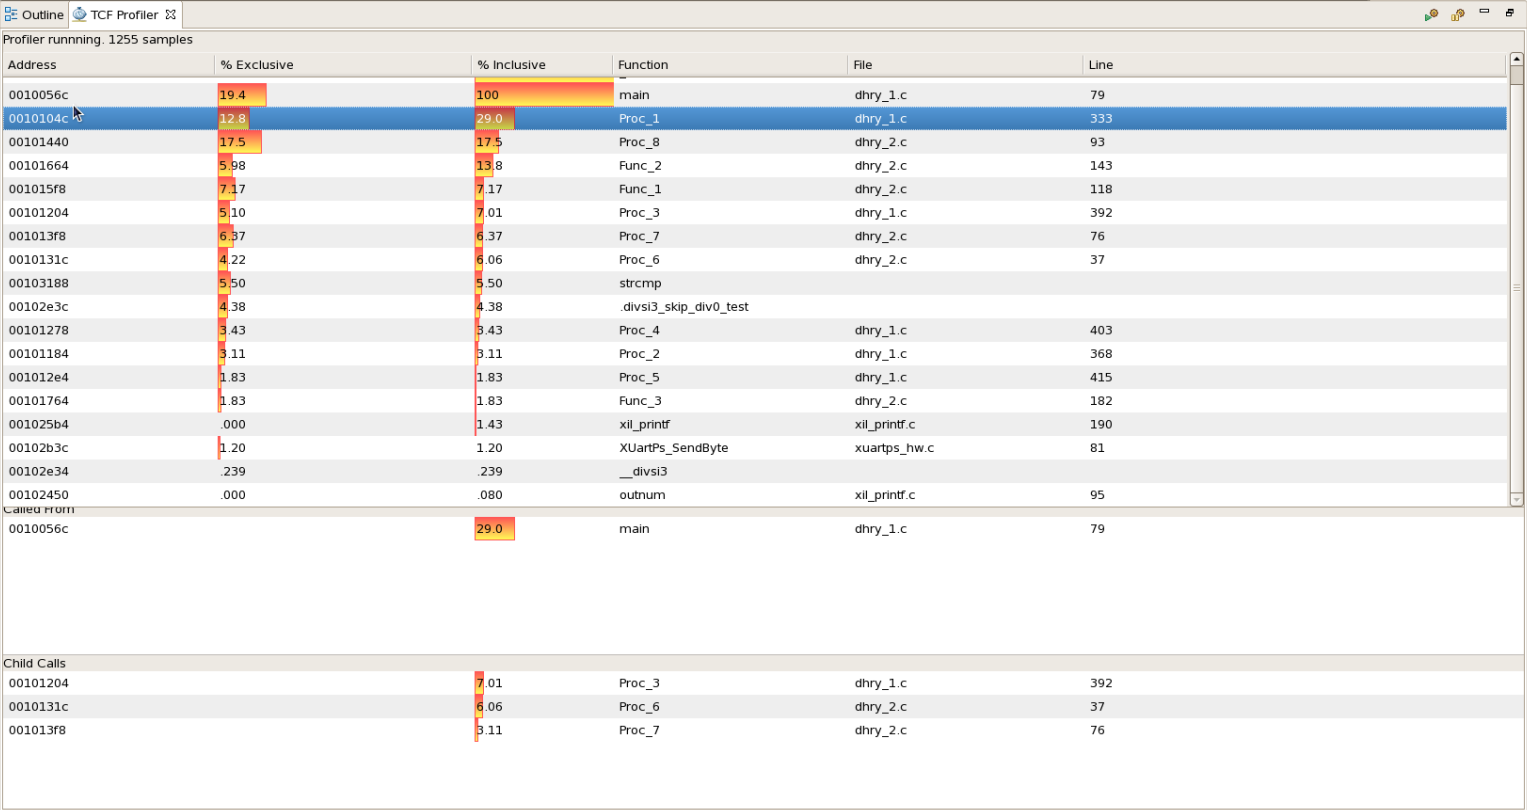
- Resume your application. The profiler view will be updated with the data as shown the figure below