Xilinx® SDK supports collection and analysis of trace events generated by FreeRTOS
based applications. Zynq® UltraScale+™ MPSoC processors support the Software Trace Microcell
(STM) block which is a software application driven trace source to generate a SoftWare
instrumentation trace (SWIT). To collect FreeRTOS events and analyze them, do the
following:
-
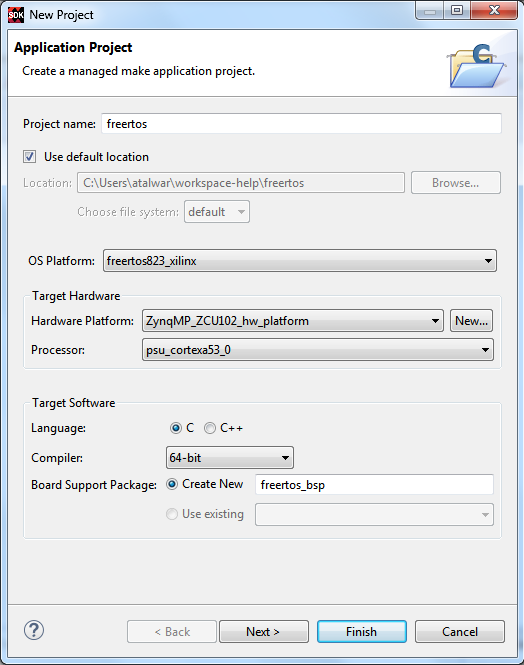
Click File > New > Application Project. The New Application
Project dialog box appears.
Note: This is equivalent to clicking on File > New > Project to open the New
Project wizard, selecting Xilinx > Application Project, and clicking Next.
-
Type a project name into the Project Name field.
-
Select the location for the project. You can use the default location as displayed in
the Location field by leaving the Use default location check box selected.
Otherwise, click the check box and type or browse to the directory location.
-
The OS Platform allows you to select which operating system you will be writing
code for. Select freertos823_xilinx.
Note: This selection alters what templates you view in the next screen and what supporting
code is provided in your project.
-
Select the Hardware Platform XML or HDF file, if it was not specified
earlier.
If you have not build hardware yet, you can select one of the pre-defined platforms
from the drop-down. Alternatively, you can drag and drop an existing hardware
specification XML/HDF file or search for one by clicking the New button and create
a new hardware project. After completing the new hardware project creation, you are
returned to the New Application Project dialog box.
-
From the Processor drop-down list, select the processor for which you want to
build the application. This is an important step when there are multiple processors in
your design such as any Zynq® PS.
-
Select your preferred language: Cor C++.
-
Select the compiler: 64-bit or
32-bit.
-
Select a Board Support Package. You can opt to have the tools build a customizable BSP
for this application, or you can choose an existing BSP.
-
Click Next to advance to the Templates screen.
-
SDK provides useful sample applications listed in Templates dialog box that you
can use to create your project. The Description box displays a brief description of
the selected sample application. When you use a sample application for your project, SDK
creates the required source and header files and linker script.
-
Select the desired template. If you want to create a blank project, select the Empty
Application. You can then add C files to the project, after the project is
created.
-
Click Finish to create your FreeRTOS application project and board support
package (if it does not exist).
-
Open and change the value of enable_stm_event_trace to
true.
-
Click Run > Debug Configurations.
-
In the Debug Configurations dialog box, double-click Xilinx
C/C++ application to create a launch configuration for the selected project.
-
Click Debug. Debugging begins, with the processors in the
running state.
-
Debug the project using the system debugger on the required target.
-
Wait for project to be downloaded on to board and stop at
main().
-
Click . The Show View dialog box appears.
-
Select Trace Session Manager from the Show
View dialog box. The launch configuration related to the application being
debugged can be seen in the Trace Session Manager view.
-
Click the start button, in the Trace Session Manager view
toolbar, to start the FreeRTOS trace collection.
-
Switch to the Debug view and resume the project.
-
Allow the project to run.
-
Switch back to the Trace Session Manager view and stop the trace
collection. All the trace data collected will be exported to suitable trace file and will
be opened in Events editor and the FreeRTOS
Analysis view.