Standalone Application Debug using System Debugger on QEMU
-
Double-click Xilinx C/C++ application (System Debugger on QEMU) to create a new
configuration.
Note: Only Zynq® UltraScale+™ MPSoC based hardware platforms can be selected for standalone application debugging.
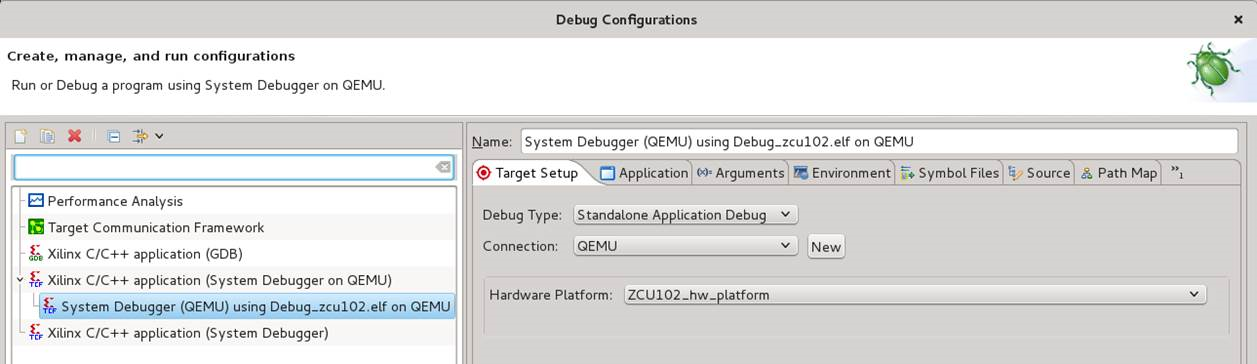
- Click Debug.
-
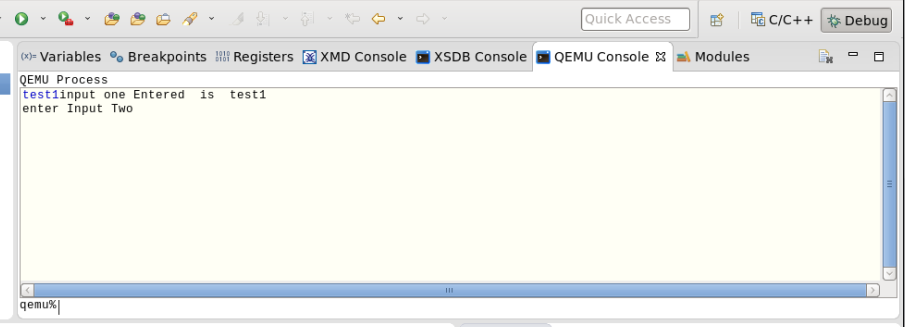
You can also launch the QEMU Console by selecting menu. The QEMU Console can be used to interact with the program running on QEMU. The STDIN can be provided in the input box at the
qemu%prompt. Output is displayed in the area above the input text.