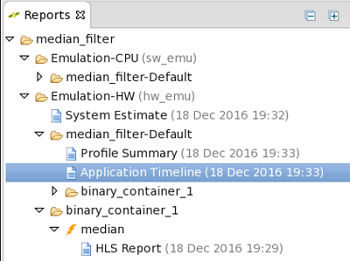
For SDx™ Development Environmet users,
double-click Application Timeline in the
Reports window to open the Application Timeline window.
Figure: Reports Window
For XOCC/Makefile users, follow the steps below to open the timeline report to
visualize host and device events during application execution.
Start the SDx environment IDE by running the
command:
$sdx
Choose a workspace when prompted.
Select File > Open File, browse to the .wdb file generated during
hardware emulation or system run, and open it.
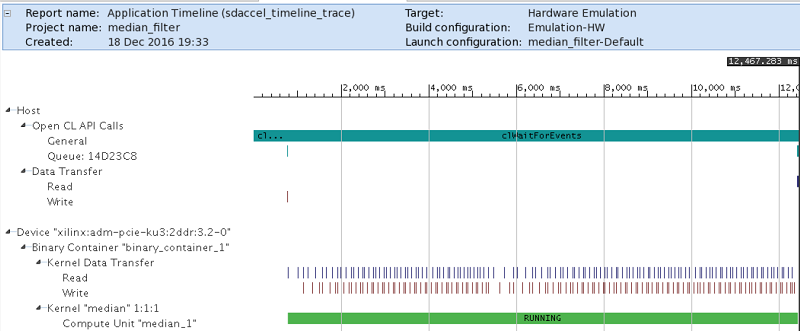
Below is a snapshot of the Application Timeline window that
displays host and device events on a common Timeline. This information helps you to
understand details of application execution and identify potential areas for
improvements.