Use the following methods to display the SDAccel™ Profile Summary.
Web Browser
The HTML profile summary can be displayed in a Web Browser by using
the following commands.
sdx_analyze profile -i
sdaccel_profile_summary.csv -f html
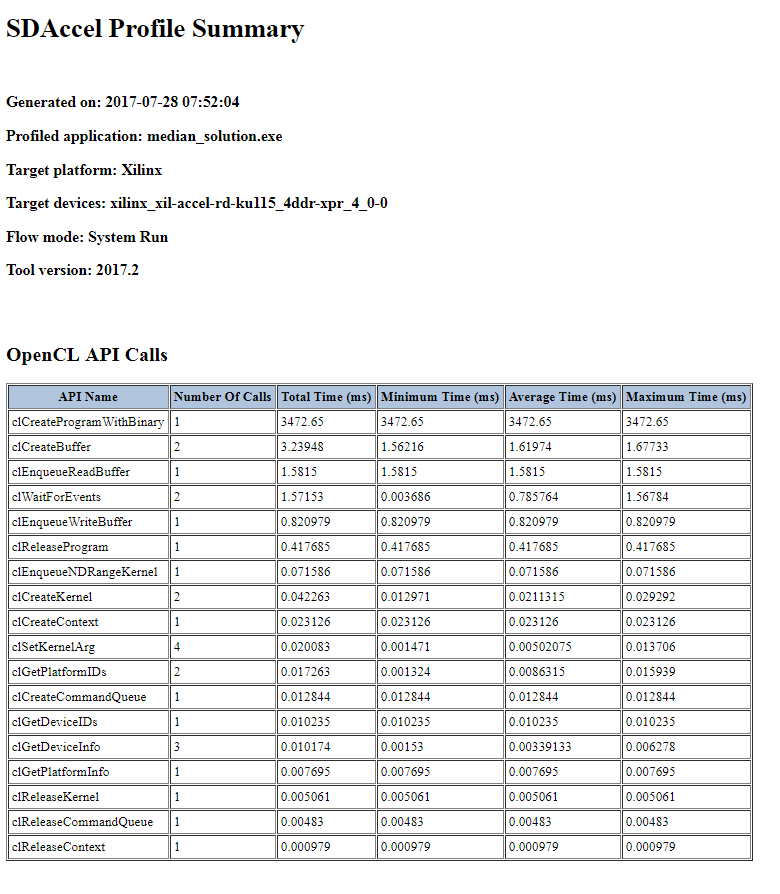
The following figure shows the profiling result from a system run on
the FPGA.
Profile Summary Viewer
Use the integrated “Profile Summary Viewer” to display profile
summary generated from the SDAccel GUI or XOCC/Makefile
flow.
For SDAccel GUI users, double click Profile Summary in the Reports window to open the
Application Timeline window.
For XOCC/Makefile users, follow these steps to open the profile summary in the
Profile Summary Viewer:
Start SDAccel GUI by running the
sdx
command:
$sdx
Choose the default workspace when prompted.
Select File > Open File, browse to and then open the .xprf file created by the sdx_analyze command from data generated during an
emulation or system run.
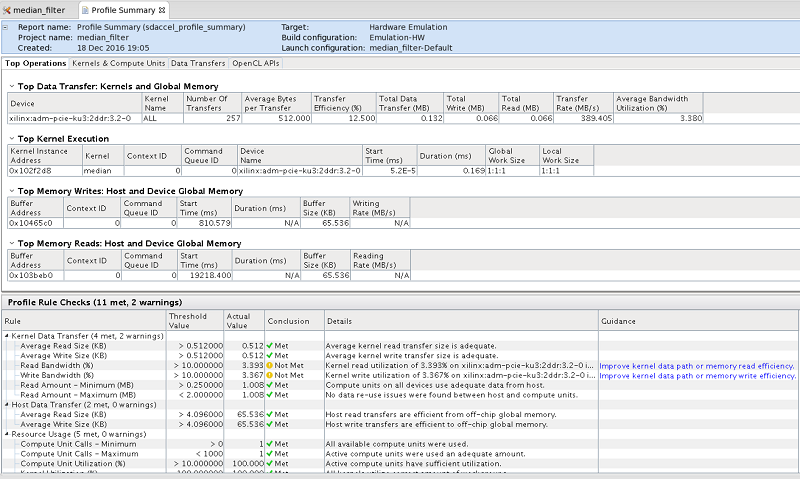
Below is a snapshot of the Profile Summary window that displays OpenCL API calls,
kernel executions, data transfers, and profile rule checks (PRCs).